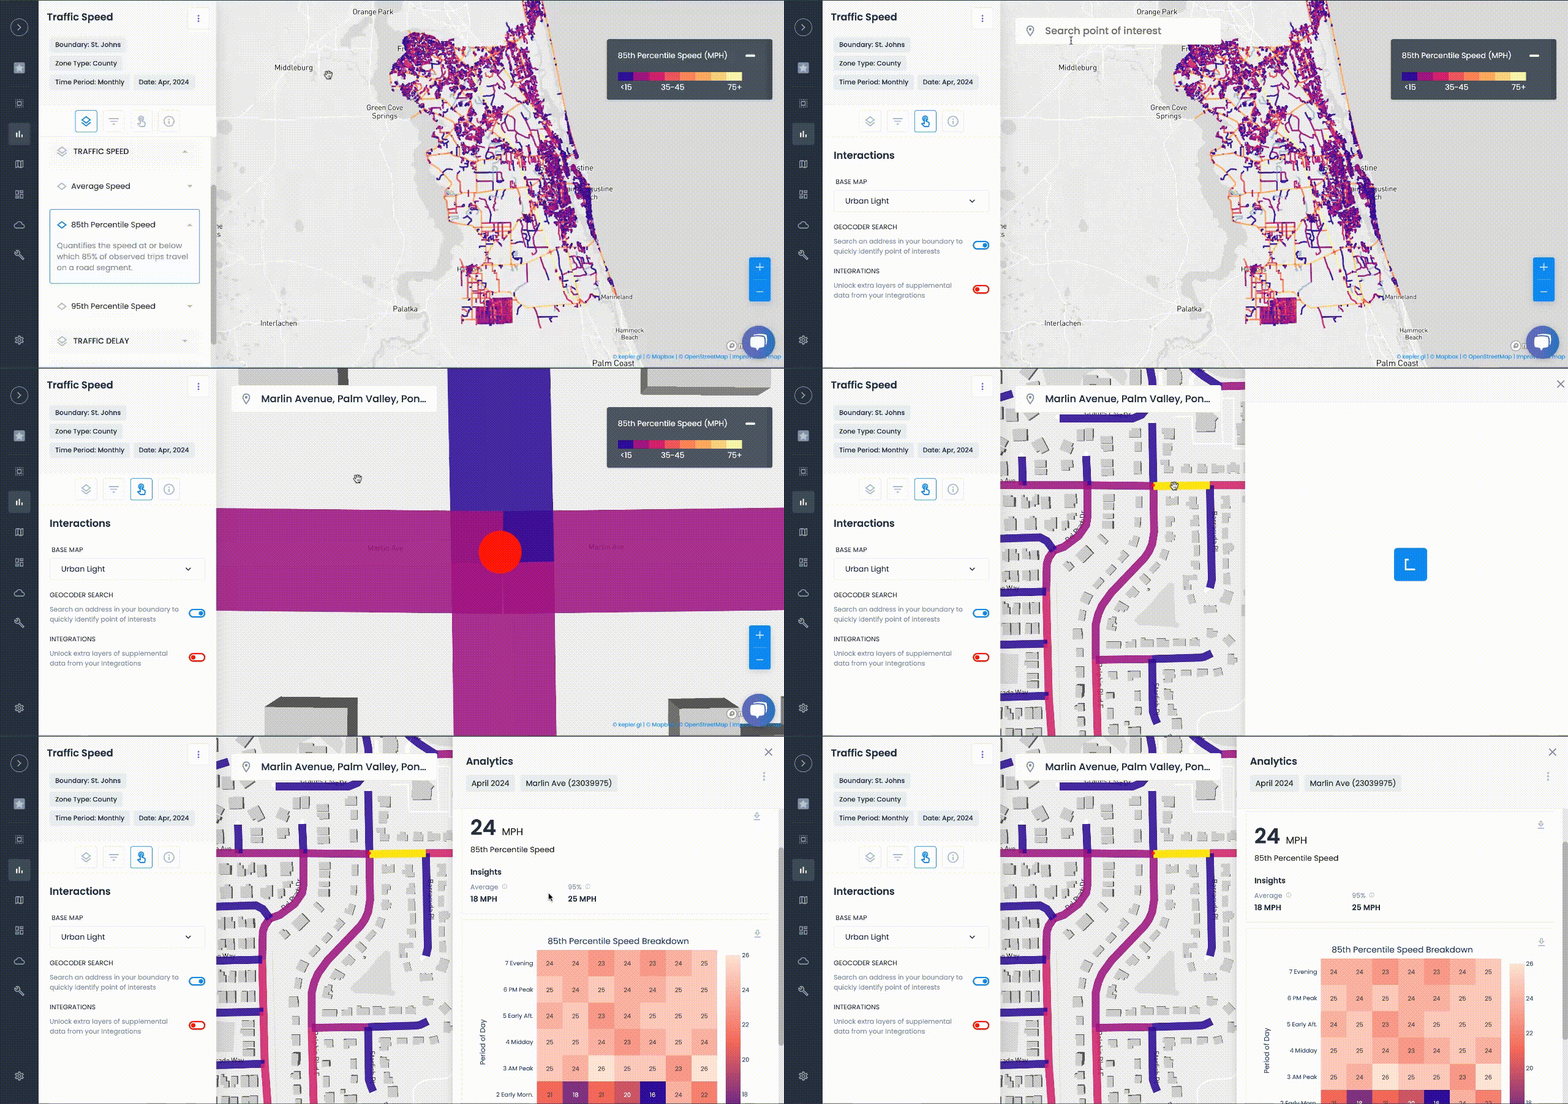

In an effort to streamline consistency, increase the speed of access to future data visualization, and make cost-effective choices, the Florida Department of Transportation (FDOT) District 2 has partnered with Urban SDK to license a platform of real-time performance measures. Through our work with FDOT District 2, we have provided a configurable analytics tool to automate corridor analysis, standardize performance measures reporting, and streamline statewide data visualization.
By automating performance measures and analysis with access to an accurate, extensive global data exchange for traffic, safety, weather, ride-share, carriers, and consumer apps, as well as local, state, and federal open datasets, Urban SDK eliminated FDOT’s need for data silos. We also created a real-time index of integrated data.This allowed for automation of performance measure analysis and reporting to optimize services.
CUSTOMER SUCCESS
200+ cities in North
America are making
streets safer


USE CASES
Automate daily tasks and
save hundreds of hours
Replace manual data collection, analysis and tasks with one simple platform.
RETURN ON INVESTMENT
Empowering the road forward with geospatial AI
Urban SDK provides precise hourly speed data to evaluate complaints and deploy resources efficiently for the greatest impact to public safety.
Urban SDK provides precise hourly speed data to evaluate complaints and deploy resources efficiently for the greatest impact to public safety.
Save Time
Replace manual tasks, outsourced analysis, and expensive hardware with data and AI.
Improve Safety
Identify lurking traffic safety, infrastructure conditions, and natural disaster risks.
Respond Faster
Respond to citizen complaints and clear your backlog sooner with fewer resources.
Report Progress
Generate custom reports, share data, and automate public complaints task work in just a few clicks.
Live DEMO
EXPERIENCE OUR PLATFORM
View traffic data and analytics to replace manual data collection,
save your staff time, and overcome budget shortfall.

Brighton, CO
Population: 42,000
Brighton is a home rule municipality city located in Adams and Weld counties, Colorado, United States.

Mansfield, TX
Population: 78,000
City of Mansfield, TX is part of the Dallas-Fort Worth area. The city is located mostly in Tarrant County.

Pinellas County, FL
Population: 960,000
Pinellas County is the most densely populated county in Florida, with 3,491 residents per square mile.
WEBINAR
Identify speeding and proactively enforce issues
See just how quick and easy it is to identify speeding, address complaints, and deploy officers.


