
Urban SDK provides traffic ops and planning staff with traffic data, analytics, and workflow automation tools for safer roads.


Public Transportation
Traffic safety
powered by AI
Hourly traffic data and analytics tailored to help you manage traffic calming, public complaints and traffic operations.
AI & data for critical
traffic ops workflow

INSIGHTS
Resolve issues, before they are problems
Automate traffic enforcement and public complaint response with AI powered analysis.

Geospatial DATA
Replace outdated, manual processes
Get hourly traffic data, roadway conditions on every road from a global connected network.

WORKFLOW
Align policy with measurable actions
Track and report enforcement and public complaint response from a centralized platform.

Integration
Mission critical information in one place
Integrate your local systems to calibrate decision making and after action reporting.
CUSTOMER SUCCESS
300+ cities in North
America are making
streets safer

We are realizing great time savings due to having the information "at our fingertips." We are not making nearly as many trips to the field to set up speed/volume tubes.
%201.png)
City of Camas, WA
City of Camas Public Works
.jpeg)
We highly recommend Urban SDK to any city or municipality looking to enhance their traffic management capabilities. You're great people and I have enjoyed working with you immensely.

City of Sanford, FL
City of Sanford Public Works
.jpeg)
The value lies in the analysis, reports, and data. Urban SDK's platform provides easy access to quick, reliable data that helps us make faster decisions. This allows us to focus our energy on the major long-term projects that require significant effort and brainpower.

City of McAllen, TX
City of McAllen Public Works
.jpeg)
Urban SDK provides quick and easy access to speed and traffic counts data that is crucial for public agencies when answering to directly affected stakeholders.

City of El Cajon, CA
City of El Cajon
.jpeg)
Urban SDK has a great support team and user-friendly software. The City of Fort Pierce knows the great benefits the SDK brings to the table.

City of Fort Pierce, FL
City of Fort Pierce Public Works

Now when citizens show up to see if there is a speeding problem on their residential roadway I am able to provide the information without keeping them waiting.

City of Chesapeake, VA
City of Chesapeake Public Works

This is a very quick and easy program to verify speed data throughout the community. Urban SDK allows us to confirm or deny the traffic speed complaints. It also allows our traffic officers to find the areas of higher speed to work on and comply with the posted speed limit.
.png)
City of Fate, TX
City Fate Department Of Public Safety

I really like how easy it is to see in a glance where the hotspots are. We have our patriot and traffic folks focus on a hotspot for the month to see if we can drive down the average and 85th percentile speeds ... [using] the software to identify problem areas and then focus enforcement and measure compliance.

City of Farmers Branch, TX
Farmers Branch Police Dept.


Modernize traffic engineering, without the hardware
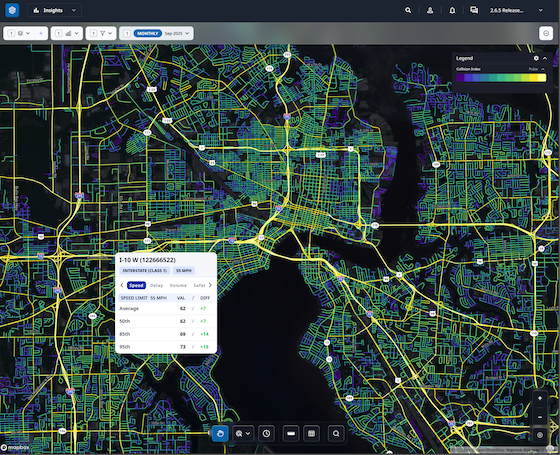
Quickly visualize traffic conditions and safety risk on every road, every day.
See All Roads
Get daily hourly traffic conditions on every road.

Filter by Road or Address
Refine data by road name, type or specific address using the road class filters.

Filter by Time and Date
Compare current and historic traffic conditions by time of day, day of week, shift or verify complaints.


Speeds, Volumes & Collision Risk
Data layers provide multiple metrics to compare speeds, volumes, collision index, and speed limits.

Uncover Issues Quickly
Select any road segment for a report or filter the entire city to uncover issues.

Identify traffic conditions and trends instantly
A global index of vehicle and satellite data for any road in a matter of minutes.

47 MPH
Average Speed
Speed Limit
40 MPH
85%
56 MPH
95%
59 MPH

Road Segment ID
776737347
Location
San Francisco, California
Road Class
State Roads (class 3)
Length
0.08078 miles
Road Name
2A
Speed Limit
40 MPH
Speed Limit Source
Urban SDK
Data Layer
Traffic Speed
Gain access to traffic speed from connected vehicles on all your local roads. Insights reports allow users to gauge roadways with average, percentile speeds, and filter by time period or date ranges.
Urban SDK provides precise hourly speed data to evaluate complaints and deploy resources efficiently for the greatest impact to public safety.
Urban SDK provides precise hourly speed data to evaluate complaints and deploy resources efficiently for the greatest impact to public safety.

Daily Traffic
Traffic speeds are reported hourly on all roads without any hardware.

Road Network
Traffic speeds are associated with global linear referencing.

Customizable analysis & reporting
Filter traffic data to easily create custom reporting
- Speeds
- Speed Limit
- Road Class
- Segments
- Time Period
- Date Range
- Day of Week
- Zones
Mitigate collision risk with road scoring
Identify and rank roads with the highest collision risk from an annual road score.

0.57 (High)
Collision Index
Road Segment ID
1329450362
Location
San Francisco, California
Road Class
Local (class 5)
Length
0.11744 miles
Road Name
Perry St
Speed Limit
30 MPH
Data Layer
Collision Index
Using an index of 5-year historical fatal crashes, traffic volumes, speeding, roadway and neighborhood characteristics, officials can pinpoint hotspots across their entire roadway network.
Urban SDK provides precise hourly speed data to evaluate complaints and deploy resources efficiently for the greatest impact to public safety.
Urban SDK provides precise hourly speed data to evaluate complaints and deploy resources efficiently for the greatest impact to public safety.
Risk Score
The collision index creates a risk score value for each road segment ranging from 0 to 1
Dangerous Roads
Identify and monitor high collision corridors with bookmarks to alert traffic enforcement
Compare trends pre- and post- enforcement
Collision index models risk with collisions, traffic, and roadway design
- Intersection widths
- Sidewalks & facility widths
- School Zones
- Traffic Speed
- Collisions
- Signage
Get traffic volume on every road without hard counts
Daily and annual traffic volumes are available on every road. Counts are refreshed automatically.

1,500 vehicles
Volume (Annual Avg. Hourly Traffic)
24,500 vehicles
Volume (Annual Avg. Daily Traffic)
350,000 miles
Vehicle Miles Travelled (VMT)
Road Segment ID
23614104
Location
San Francisco, California
Road Class
Local (class 5)
Length
0.06338 miles
Road Name
Pierce St
Speed Limit
30 MPH
Speed Limit Source
Urban SDK
Data Layer
Traffic Volume
Gain access to VMT and AADT on all your local roads with Urban SDK’s Traffic Volume Data. See how many cars are traveling along your roadways, and quickly share what roads are operating at capacity.
Urban SDK provides precise hourly speed data to evaluate complaints and deploy resources efficiently for the greatest impact to public safety.
Urban SDK provides precise hourly speed data to evaluate complaints and deploy resources efficiently for the greatest impact to public safety.
Annual Average Daily Traffic
Annual average daily traffic (AADT) measures how much traffic uses a road or highway in a year.
Vehicle Miles Traveled
Vehicle miles traveled (VMT) measures the amount of travel for all vehicles over a segment.
Visualize congestion and travel times on every road
Improve congestion management and traffic signal timing with historical hourly traffic analysis.

1.94
Travel Time Index
Avg. Travel Time
8 Minutes
PTI
3.78
BTI
1.8

Road Segment ID
841593272
Location
Cuyahoga, Ohio
Road Class
Arterial (class 4)
Length
0.0379 miles
Road Name
E 9th St
Speed Limit
30 MPH
Speed Limit Source
Urban SDK
Data Layer
Traffic Delay
See how congestion impacts specific routes, construction zones and any intersection with hourly with Travel Time, Travel Time Index and Planning Time on every road.
Urban SDK provides precise hourly speed data to evaluate complaints and deploy resources efficiently for the greatest impact to public safety.
Urban SDK provides precise hourly speed data to evaluate complaints and deploy resources efficiently for the greatest impact to public safety.
Travel Time
Three traffic delay layers quantify the impacts of congestion on travel time.
Historical Data
Access 13 months of historical hourly congestion to compare events.
Quickly Identify Speeding to Suggest Counter Measures
Visualize hotspots and compare speeds against posted speed limits.

11.48 MPH
Average Difference
Speed Limit
30 MPH
85% Difference
13 MPH
95% Difference
53 MPH

Road Segment ID
120906391
Location
San Francisco, California
Road Class
Local (class 5)
Length
0.17523 miles
Road Name
Iowa St
Speed Limit
30 MPH
Speed Limit Source
Urban SDK
Data Layer
Speed Limit Difference
Compare hourly speeds of observed trips on every road segment against the posted speed limit.
Urban SDK provides precise hourly speed data to evaluate complaints and deploy resources efficiently for the greatest impact to public safety.
Urban SDK provides precise hourly speed data to evaluate complaints and deploy resources efficiently for the greatest impact to public safety.
Average Difference
Compare average hourly traffic speeds.
85th & 95th
Compare 85th or 95th percentile hourly traffic speeds.
Import Speed Limits
Import your local speed limit files at any time or leverage Urban SDK's continuous speed limit index.
Get road characteristics inventory on every road from satellite data
Automate roadway characteristics inventory surveys anywhere in the world.
Road Segment ID
120906391
Location
San Francisco, California
Road Class
Local (class 5)
Length
0.17523 miles
Road Name
Iowa St
Speed Limit
30 MPH
Road Surface Type
Asphalt
Average Road Surface Width
Urban SDK
Vehicle Lanes
2
Average Lane Width
Urban SDK
Street Parking Type
Urban SDK
Street Parking Sideg Type
Urban SDK
Estimated Street Parking Stalls
Urban SDK
Average Sidewalk Width
Urban SDK
Sidewalk Side
Urban SDK
Sidewalk Type
Urban SDK
Average Sidewalk Road Separation (ft)
Urban SDK
Average Bike Width
Urban SDK
Data Layer
Road Characteristics
Road Characteristics are collected from aerial imagery and processed by Urban SDK to quantify road geometry and attributes that represent the road's 3D design.
Urban SDK provides precise hourly speed data to evaluate complaints and deploy resources efficiently for the greatest impact to public safety.
Urban SDK provides precise hourly speed data to evaluate complaints and deploy resources efficiently for the greatest impact to public safety.
Average Difference
Compare average hourly traffic speeds.
85th & 95th
Compare 85th or 95th percentile hourly traffic speeds.
Import Speed Limits
Import your local speed limit files at any time or leverage Urban SDK's continuous speed limit index.
- Speeds
- Speed Limit
- Road Class
- Segments
- Time Period
- Date Range
- Day of Week
- Zones
PREVIEW DEMO
EXPERIENCE OUR PLATFORM
View traffic data and analytics to replace manual data collection,
save your staff time, and overcome budget shortfall.

Traffic Calming
VALIDATE SAFETY IMPROVEMENTS
Explore our traffic calming solution providing speed, volume, and collision risk on every road in your community.

Traffic Enforcement
Target speeding hotspots
Explore our traffic enforcement solution providing speeding and collision risk hotspots to assign patrol by time of day.

Traffic Delay
monitor commuting & Traffic Signals
Explore our traffic delay solution to monitor travel time, traffic signal timing, and critical commuting corridors.
Traffic Calming
Explore our traffic calming solution providing speed, volume, and collision risk on every road in your community.

Traffic Enforcement
Explore our traffic enforcement solution providing speeding and collision risk hotspots to assign patrol by time of day.
Travel Delay
Explore our traffic delay solution to monitor travel time, traffic signal timing, and critical commuting corridors.
TRAFFIC CALMING FEATURES
80% of citizen complaints
are a perception problem
Urban SDK provides precise speed and volume data to evaluate complaints and deploy traffic calming resources to improve public safety.
Urban SDK provides precise speed and volume data to evaluate complaints and deploy traffic calming resources to improve public safety.

Manage Public Complaints
Agencies can respond to complaints within 5 minutes, eliminating the need to collect data on streets with perception-based issues.

Pre & Post Implementation
Agencies can monitor and analyze the impact of construction and countermeasures to report resource or project effectiveness.

Proactive Safety Measures
Empower your staff with daily road data to identify, enforce and apply countermeasures to dangerous areas.

Reporting and Communication
Automate PDF reports to provide officials and constituents with clear, reports to document community progress.
Get 30 days of speeding, traffic volume and collision indexing in your state.


Customer success across
hundreds of cities
See how geospatial ai is empowering proactive public safety in large and small communities.
Urban SDK Raises $65M Growth Round from Riverwood Capital to Scale AI-Powered System of Action for Local Governments, Transforming Public Safety and Service
Funding Accelerates Expansion of Geospatial AI Technology, Helping Cities Efficiently Respond to Critical Safety Concerns
Urban SDK Raises $65M Growth Round from Riverwood Capital to Scale AI-Powered System of Action for Local Governments, Transforming Public Safety and Service
Funding Accelerates Expansion of Geospatial AI Technology, Helping Cities Efficiently Respond to Critical Safety Concerns
Traffic Volumes
Building Internal Traffic Analysis Capacity: A Roadmap for Reducing Consultant Reliance
Cities cut consultant reliance with mobility data to validate traffic calming, stop-control requests, and speed concerns using Urban SDK.
Traffic Volumes
Building Internal Traffic Analysis Capacity: A Roadmap for Reducing Consultant Reliance
Cities cut consultant reliance with mobility data to validate traffic calming, stop-control requests, and speed concerns using Urban SDK.
Traffic Volumes
How Cities Can Use Traffic Volume Variability to Evaluate Stop-Control Warrants
Cities use traffic volume and continuous data to assess stop-control warrants, prioritize requests, and make decisions with Urban SDK.
Traffic Volumes
How Cities Can Use Traffic Volume Variability to Evaluate Stop-Control Warrants
Cities use traffic volume and continuous data to assess stop-control warrants, prioritize requests, and make decisions with Urban SDK.
WEBINAR
Identify speeding and proactively enforce issues
See just how quick and easy it is to identify speeding, address complaints, and deploy officers.
