Road Safety
Collision Index: Proactive Traffic Safety Powered by AI
Communities now have another layer of road safety thanks to Urban SDK’s Collision Index
Communities now have another layer of road safety thanks to Urban SDK’s Collision Index.
Recent studies have shown that, with regards to fatal automobile collisions, speed was a factor in roughly 27% of the cases. Moreover, every 5 mph reduction in speed dramatically increases the likelihood of pedestrian survival.
Thus, when evaluating road safety — or whether a city can truly achieve Vision Zero — there is a direct correlation between speed and fatalities.
Already a leader in empowering safer streets, Urban SDK’s latest data layer — Collision Index — further enables community stakeholders to proactively monitor and enforce roadways.
By using Urban SDK’s platform, officials can employ a three-step process in continuously ensuring the safety of their roadways.

Monitoring an entire jurisdiction
Using an index of 5-year historical fatal crashes, traffic volumes, speeding, roadway and neighborhood characteristics, officials can pinpoint hotspots across their entire roadway network.
Leveraging this data — alongside the Speed and Volume data already established within Urban SDK’s platform — can visualize High Injury Networks (HINs) with excessive rates of speed and severe crashes.
Targeting the most dangerous locations
After gaining a comprehensive understanding of dangerous roads, officials can filter conditions to create custom corridors, routes, and monitor vulnerable pedestrian areas
The ability to more accurately assess risks and monitor trends on roadways, enables officials to more confidently plan safety countermeasures.
Compare trends pre- and post-enforcement
The third step in road safety mitigation is more targeted reporting. Officials have the ability to track the impact of speeding and collisions both before and after enforcement or countermeasure.
This completes the loop in safety efforts.
Officials can proactively determine where to allocate resources. They can continuously monitor trends. And they can bookmark dangerous segments to ensure that roadways remain safe — and fatality free — following the implementation of countermeasures.
Methodology
Urban SDK has developed a modeling approach that uses real-world data from collision databases, along with other relevant data sources, as inputs to a statistical model.
The index is designed to help traffic enforcement, traffic engineers, and transportation planners quickly assess the potential risks across the entirety of any road system.
The collision index creates a value for each road segment ranging from 0 to 1; a segment with a value close to 1 means that it is likely that collisions may take place, and that those collisions may feature more severe injury.
Urban SDK’s CI modeling process begins with gathering input data. This includes ground truth collision records data from municipal, state, or federal databases, as well as non-traffic data which has been found to be correlated with the occurrence of collisions, such as:
- Location-based Services (LBS) data
- Roadway Characteristics data; for instance, functional class, speed limits, and road geometry
- Neighborhood Characteristics data, such as road network density, urban vs. rural environment, etc.
Our model is developed on a state-by-state basis and delivers Collision Index values on all local roads in a jurisdictional boundary.
Access your Collision Index
Urban SDK customers have access to the Collision Index in Insights reports as a new layer to combine with traffic speed and volume for a complete traffic enforcement solution.
If you are not an Urban SDK customer, more product information, pricing and an online demo are available at: https://www.urbansdk.com/insights/collision-index

TRAFFIC ENFORCEMENT FEATURES
80% of citizen complaints
are a perception problem
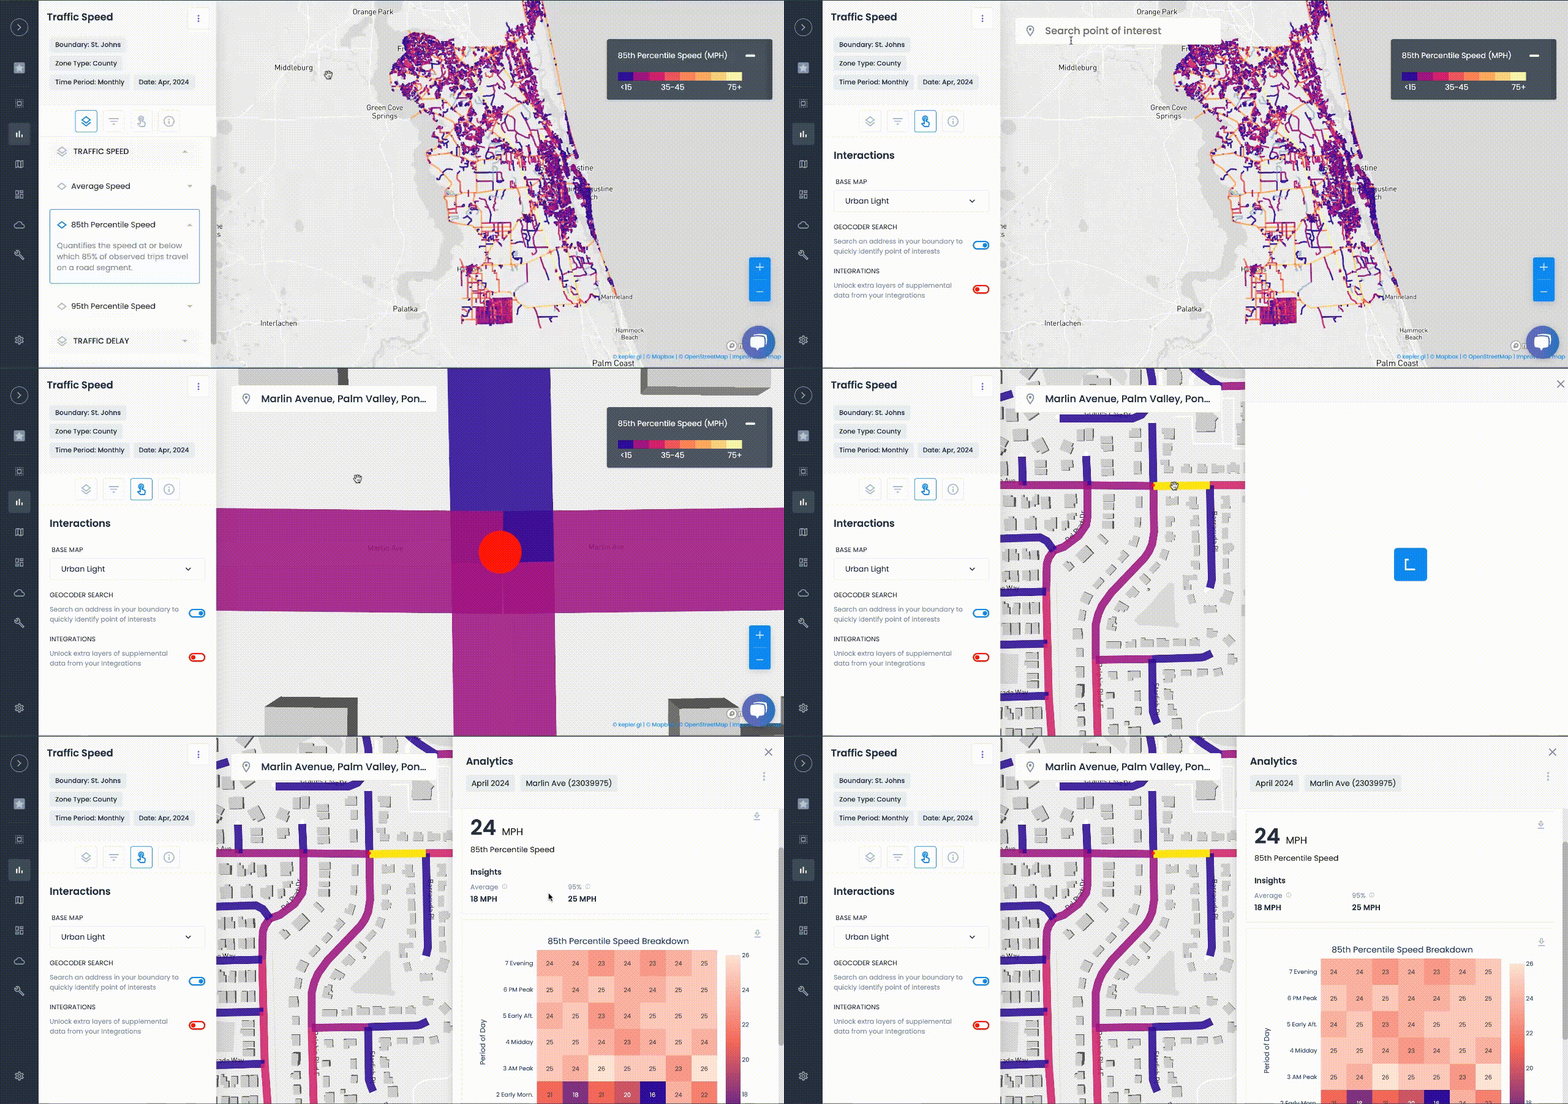
Urban SDK provides precise hourly speed data to evaluate complaints and deploy resources efficiently for the greatest impact to public safety.
Urban SDK provides precise hourly speed data to evaluate complaints and deploy resources efficiently for the greatest impact to public safety.
Target Speeding
Identify hot spots, validate monthly speeding trends and monitor vulnerable areas like school zones.
Improve Safety
Crash and citations location information to compare speed trends month over month
Fast Response
Respond to citizen complaints sooner with address search and exportable reporting
Deploy Assets
Generate maps for traffic enforcement by time of day, location or division to deploy officers to known problem areas.
RESOURCES
Customer Success
See how public sector leaders succeed with Urban SDK.
WEBINAR
Identify speeding and proactively enforce issues
See just how quick and easy it is to identify speeding, address complaints, and deploy officers.


