Road Safety
NEW: Add Crash Layer in Insights Reports
You can now upload crash data and layer it onto Insights reports inside your Urban SDK account.
You can now upload crash data and layer it onto Insights reports inside your Urban SDK account.
The FHWA reports that US vehicle fatalities are increasing nationally. Speed-related crashes are associated with 10,192 fatalities, 498,000 nonfatal injuries, and $46 billion in economic costs in 2019, accounting for 14% of all economic costs.
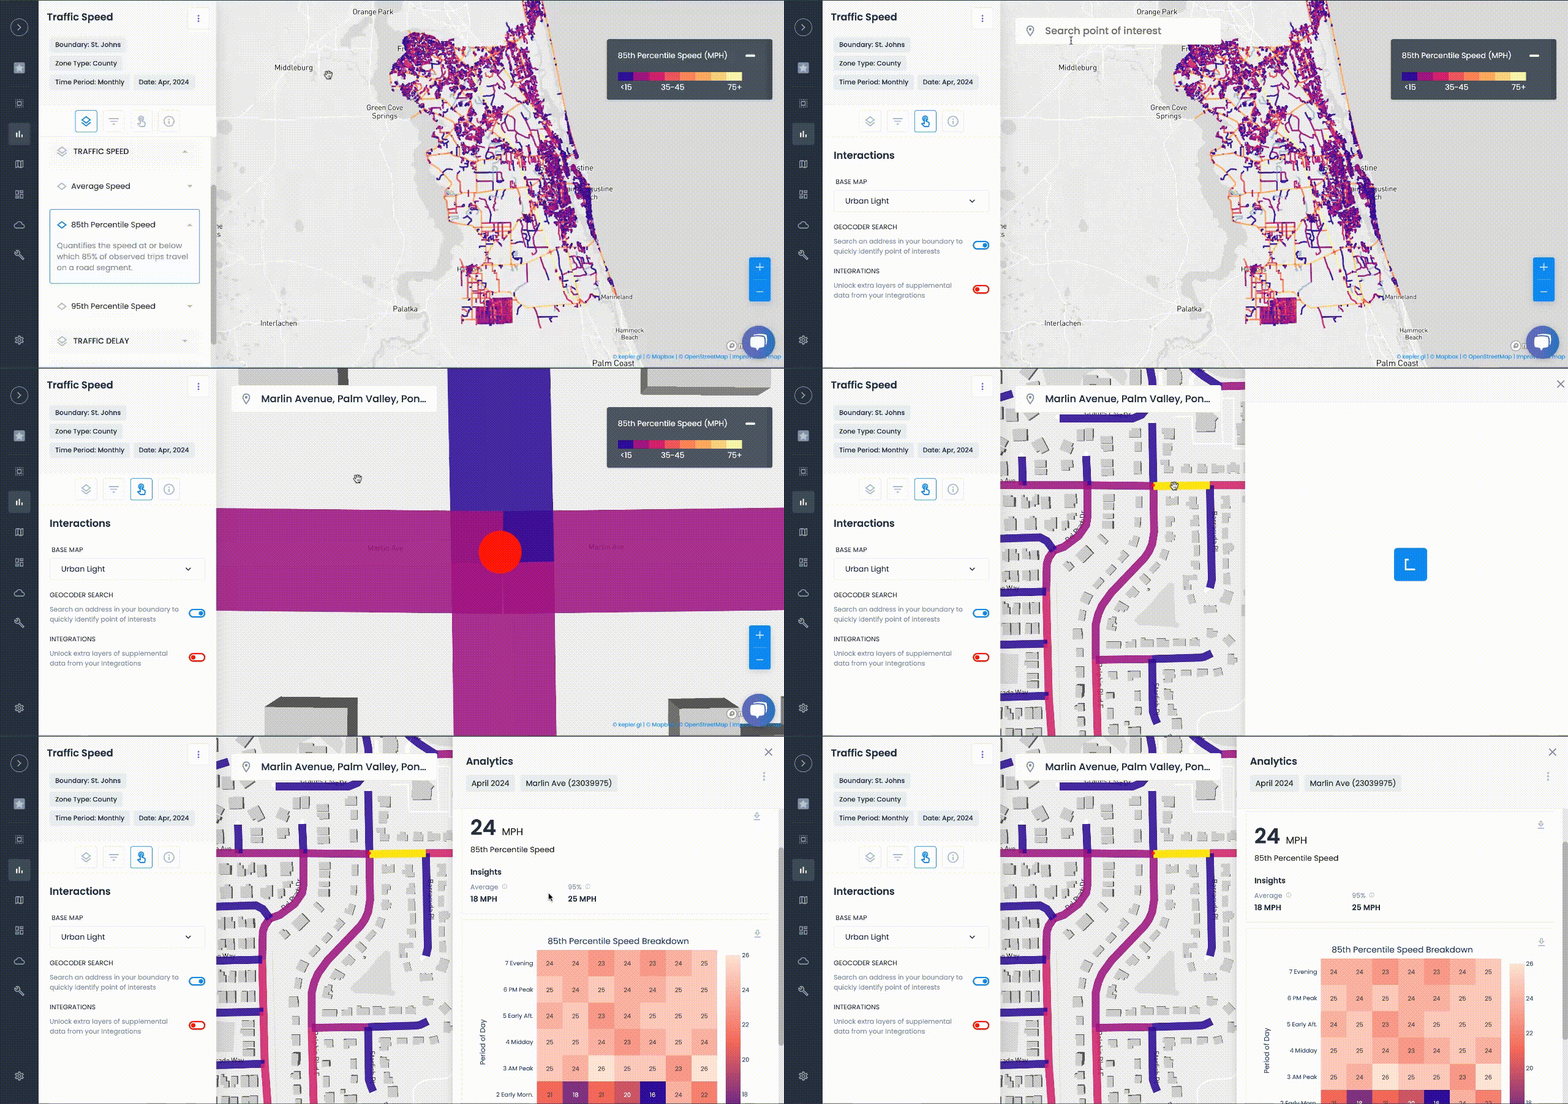
With Insights, you can add Crashes and Traffic Events to any Insights report to quickly map crashes and compare 85th Percentile speeds on every roadway within your community.
This article helps you understand how to upload crash files to develop advanced reporting for safety planning, incident reporting, transportation planning, bike & pedestrian level of stress and traffic calming studies.
What is the Crash Layer?
Crash layer allows your team to see crash locations and information in the Insights reporting maps and tooltips. Crashes will display with traffic speeds with based on the month of the incident.

Benefits to you
The crash layer helps you see crashes by time and location.
- You can turn layers on and off at any time.
- You can have multiple layers for different data sources, crash or incident types
Create monthly crash maps
- With the crash layer, you can toggle off traffic speeds to display a map of only crashes for that period

Evaluate historical speeds and crashes
- You can see crash location and the reported traffic speed for the nearest link on the same map
Organize crash files in one place
- Crashes are imported through our Crash Integration
- Location (latitude, longitude) are validated and you can match headers for severity and date/time
- Once the import is completed, your entire team can see Crashes in Insights, design custom maps in Studio, and download from your Data Hub

Create custom crash maps
- Once crash locations are validated, the file is available to be imported to any Studio map. You can create custom maps for safety planning, traffic calming analysis or incident reporting on the fly.
- Read the article on how to customize crash Integration data in Studio

Get crash integrations today
Fill out the form below if you'd like to get crash and speed data for your organization.

TRAFFIC ENFORCEMENT FEATURES
80% of citizen complaints
are a perception problem
Urban SDK provides precise hourly speed data to evaluate complaints and deploy resources efficiently for the greatest impact to public safety.
Urban SDK provides precise hourly speed data to evaluate complaints and deploy resources efficiently for the greatest impact to public safety.
Target Speeding
Identify hot spots, validate monthly speeding trends and monitor vulnerable areas like school zones.
Improve Safety
Crash and citations location information to compare speed trends month over month
Fast Response
Respond to citizen complaints sooner with address search and exportable reporting
Deploy Assets
Generate maps for traffic enforcement by time of day, location or division to deploy officers to known problem areas.
RESOURCES
Customer Success
See how public sector leaders succeed with Urban SDK.
WEBINAR
Identify speeding and proactively enforce issues
See just how quick and easy it is to identify speeding, address complaints, and deploy officers.


