Transportation Planning
Hurricane Ian Evacuation Analysis
Evaluation of evacuation trends prior to and Hurricane Ian's landfall in September 2022
Project Overview
In 2022, the Florida Transportation Builder’s Association (FTBA) worked with Urban SDK to evaluate evacuation trends related to flows in the wake of Hurricane Ian, which made landfall in South Florida, September 2022.
We studied Hurricane Ian Evacuation Distribution from Charlotte, Collier, and Lee Counties between September 25-28, 2022. The analysis identified that many external trips from affected areas were concentrated along the I-75 corridor in Sarasota (16%), Tampa (13%), and Miami (19%), whereas communities with indirect access to a major highway were less popular.
For the study, Urban SDK’s platform was used map and pull insights into origin-destination data for analysis.

Methodology
Urban SDK’s platform was used to pull insights into travel flows between September 25-28, 2022 when Hurricane Ian made landfall.
A virtual boundary around Charlotte, Collier, and Lee Counties was used to tag a sample of travel location data to and from those counties. The data points were then mapped for their origin and destinations outside of the boundary and aggregated to the nearest County. Location data was obtained through third-party sources with only Lon/Lat and timestamp provided for analysis and removed through aggregation for data privacy.

Findings
The top 10 most popular external destinations from hurricane-affected areas represented 74% of observed trip samples. The bulk of this demand was concentrated in Sarasota (16%), Tampa (13%), and Miami (19%) which accounted for 49% of external trips from hurricane-affected areas.
Communities directly adjacent to the I-75 highway corridor represented 47% of the external trip demand, whereas other counties on less popular corridors saw less demand.
Highlands County accounted for 5% of external trips, which places it at the 5th most popular destination, despite no direct highway access to it from affected areas while Polk County saw only 4% of trips despite direct access via SR 17.
Read the Full Report
Fill out the below form to real the full analysis.

TRAFFIC ENFORCEMENT FEATURES
80% of citizen complaints
are a perception problem
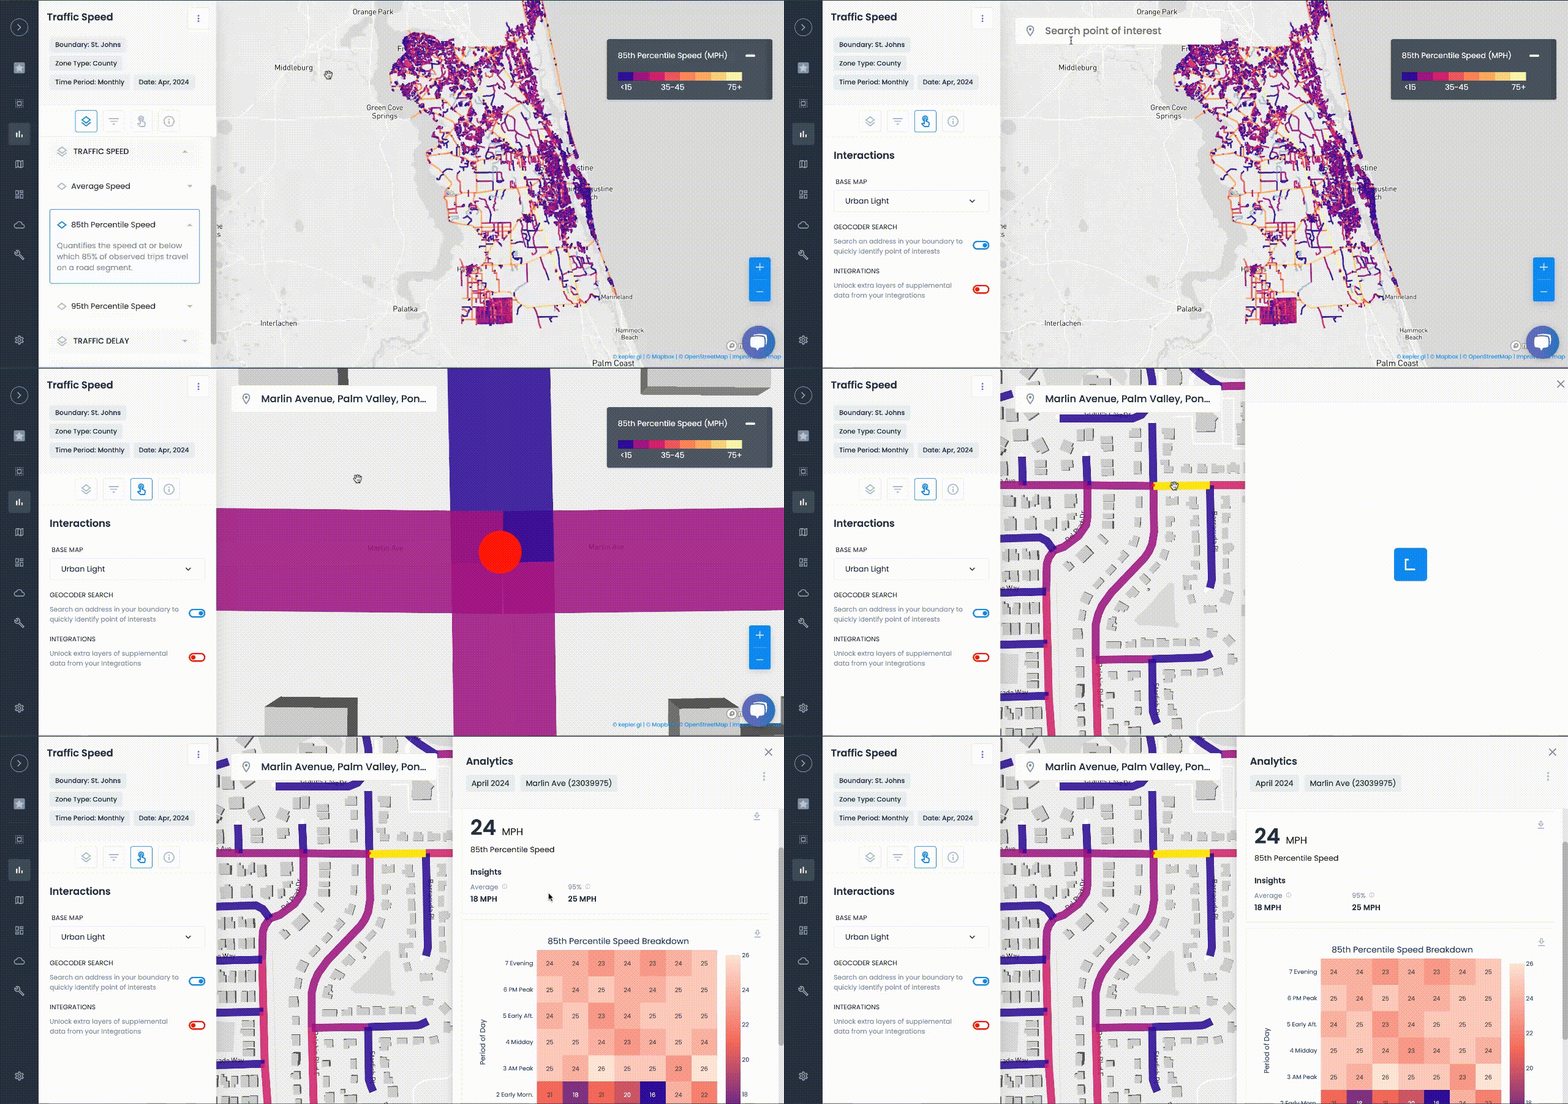
Urban SDK provides precise hourly speed data to evaluate complaints and deploy resources efficiently for the greatest impact to public safety.
Urban SDK provides precise hourly speed data to evaluate complaints and deploy resources efficiently for the greatest impact to public safety.
Target Speeding
Identify hot spots, validate monthly speeding trends and monitor vulnerable areas like school zones.
Improve Safety
Crash and citations location information to compare speed trends month over month
Fast Response
Respond to citizen complaints sooner with address search and exportable reporting
Deploy Assets
Generate maps for traffic enforcement by time of day, location or division to deploy officers to known problem areas.
RESOURCES
Customer Success
See how public sector leaders succeed with Urban SDK.
WEBINAR
Identify speeding and proactively enforce issues
See just how quick and easy it is to identify speeding, address complaints, and deploy officers.


