Transportation Planning
New Tools from Urban SDK: Custom Boundaries, Enhanced Time Filters
Urban SDK has released a new set of features that provide organizations a greater ability to analyze their roadways.
Urban SDK has released a new set of features that provide organizations a greater ability to analyze their roadways.
Our latest product launch focused on a couple of key themes: quicker analysis and a broader range of reporting.
For the former, Urban SDK customers can now save and select from premade boundaries. They can also bookmark road segments in reports, in order to pull them up more quickly in the future.
For the latter: we now provide aggregated and daily reporting. Beyond that, customers can also draw custom boundaries and investigate based on time or distance.
As a result, Urban SDK has become even more valuable to public agencies working to address road safety — enabling them to both plan for safer roads while also diagnose daily operational issues.
Measure Hourly Traffic Conditions with New Boundaries Options
Three new boundary options have been added alongside the route-building capabilities in customer accounts:
- Point Buffer: generate a buffer by placing a point and setting a distance from the point
- Time Buffer: generate a buffer by placing a point and setting a travel time from the point
- Polygon: draw a polygon by placing connected points on the map
This enhancement was the result of Urban SDK customers requesting the ability to analyze accessibility — in distance and in time — of specific points in their community.
Point Buffer Radius
You can now create traffic conditions reports by radius for either distance or travel time.
- Miles: drop a point of interest and select your radius in miles
- Travel Time: generate walk, bike, and custom travel time buffer radius around any point

Custom Polygons
You can now draw polygons to measure any general area or specific plot.

Preset Boundary Options
We've also made the preset boundaries options easier. Just click on a County, Census Tract, or previously saved custom boundary.

Enhanced Time Filters & Reports
Customers can scale from detailed hourly traffic data for daily operations and over longer period aggregated trends.

New Scorecards and Reports
We've also added new scorecards specific to day, period, and hourly ranges.

Aggregated Reports
An aggregated report averages the data across the selected time period to output a representative week of data, but users cannot review a specific date. It is broken down by period of day rather than hour of day.
- Output: Typical Week
- Day Limit: 1-31 Days
- Daily Filters: Typical day of the week (Mon-Sun)
- Period Filters: Periods of day (e.g. Overnight, Evening, etc.)
- Ideal Use Case: Planning
Aggregated reports break down the data by day of week and period of day. The filters can have more than one day of week, and more than one period of day selected to calculate aggregated data.
Daily Reports
A daily report will process individual daily data for the selected time period, giving users the ability review a specific date of data. It also provides the data broken down by hour of day.
- Output: Individual Days
- Day Limit: 1-31 Days
- Daily Filters: Specific day of the week
- Period Filters: Hour of day (0-23)
- Ideal Use Case: Daily operations
Bookmark Hotspots and Work Zones
Customers can now select and save selected road links as bookmarks in order to quickly return to them the next time you review an Insights report. Much like the preset boundaries, this should expedite your time in creating reports.

We have also expanded ways to access data on your roadways. Exported data will be stored in Data Hub where users can review the status of data processing — here you can Download, Edit, or Delete the data. Downloading the data will now provide the option to save a local copy of the data in CSV or Parquet file format (.gzip).
Customize Map Feature Layers with New Interactions
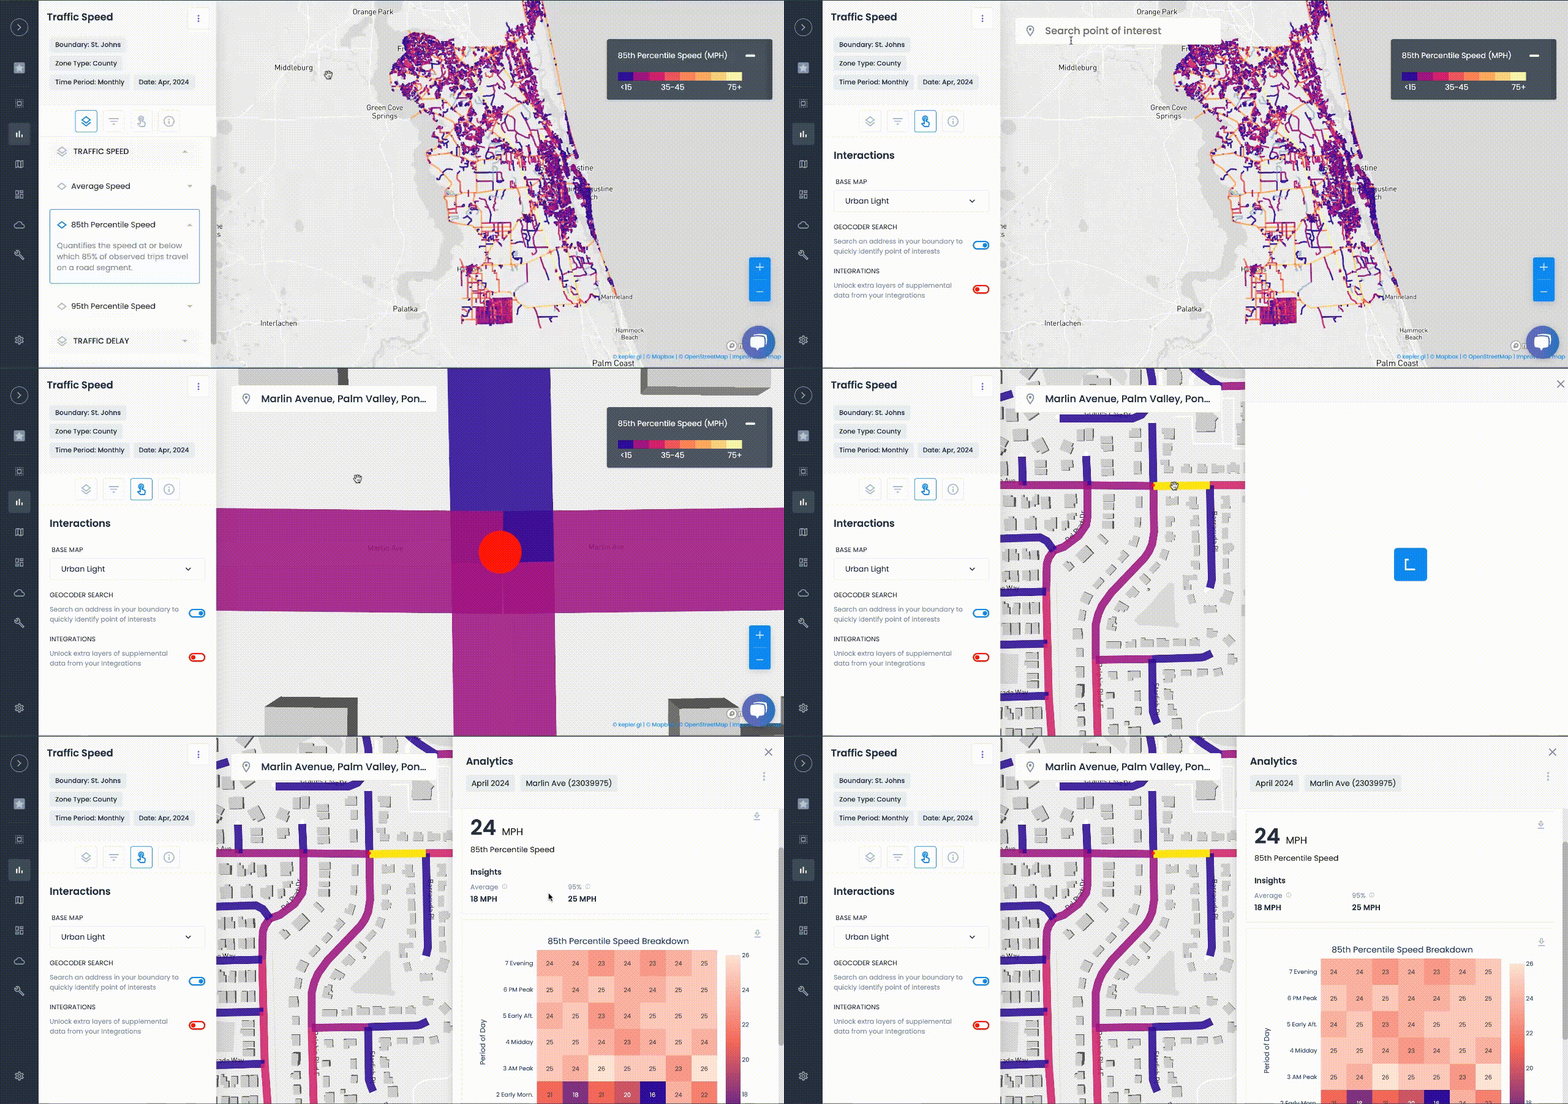
Customers can now determine specific map features to display. Easily turn on or off basemap features including roads, labels and buildings to customize your report.

To learn more, contact our team to see how Urban SDK can help with your Traffic Calming initiatives.

TRAFFIC ENFORCEMENT FEATURES
80% of citizen complaints
are a perception problem
Urban SDK provides precise hourly speed data to evaluate complaints and deploy resources efficiently for the greatest impact to public safety.
Urban SDK provides precise hourly speed data to evaluate complaints and deploy resources efficiently for the greatest impact to public safety.
Target Speeding
Identify hot spots, validate monthly speeding trends and monitor vulnerable areas like school zones.
Improve Safety
Crash and citations location information to compare speed trends month over month
Fast Response
Respond to citizen complaints sooner with address search and exportable reporting
Deploy Assets
Generate maps for traffic enforcement by time of day, location or division to deploy officers to known problem areas.
RESOURCES
Customer Success
See how public sector leaders succeed with Urban SDK.
WEBINAR
Identify speeding and proactively enforce issues
See just how quick and easy it is to identify speeding, address complaints, and deploy officers.


