Road Safety
WATCH: Safety Planning with Urban SDK
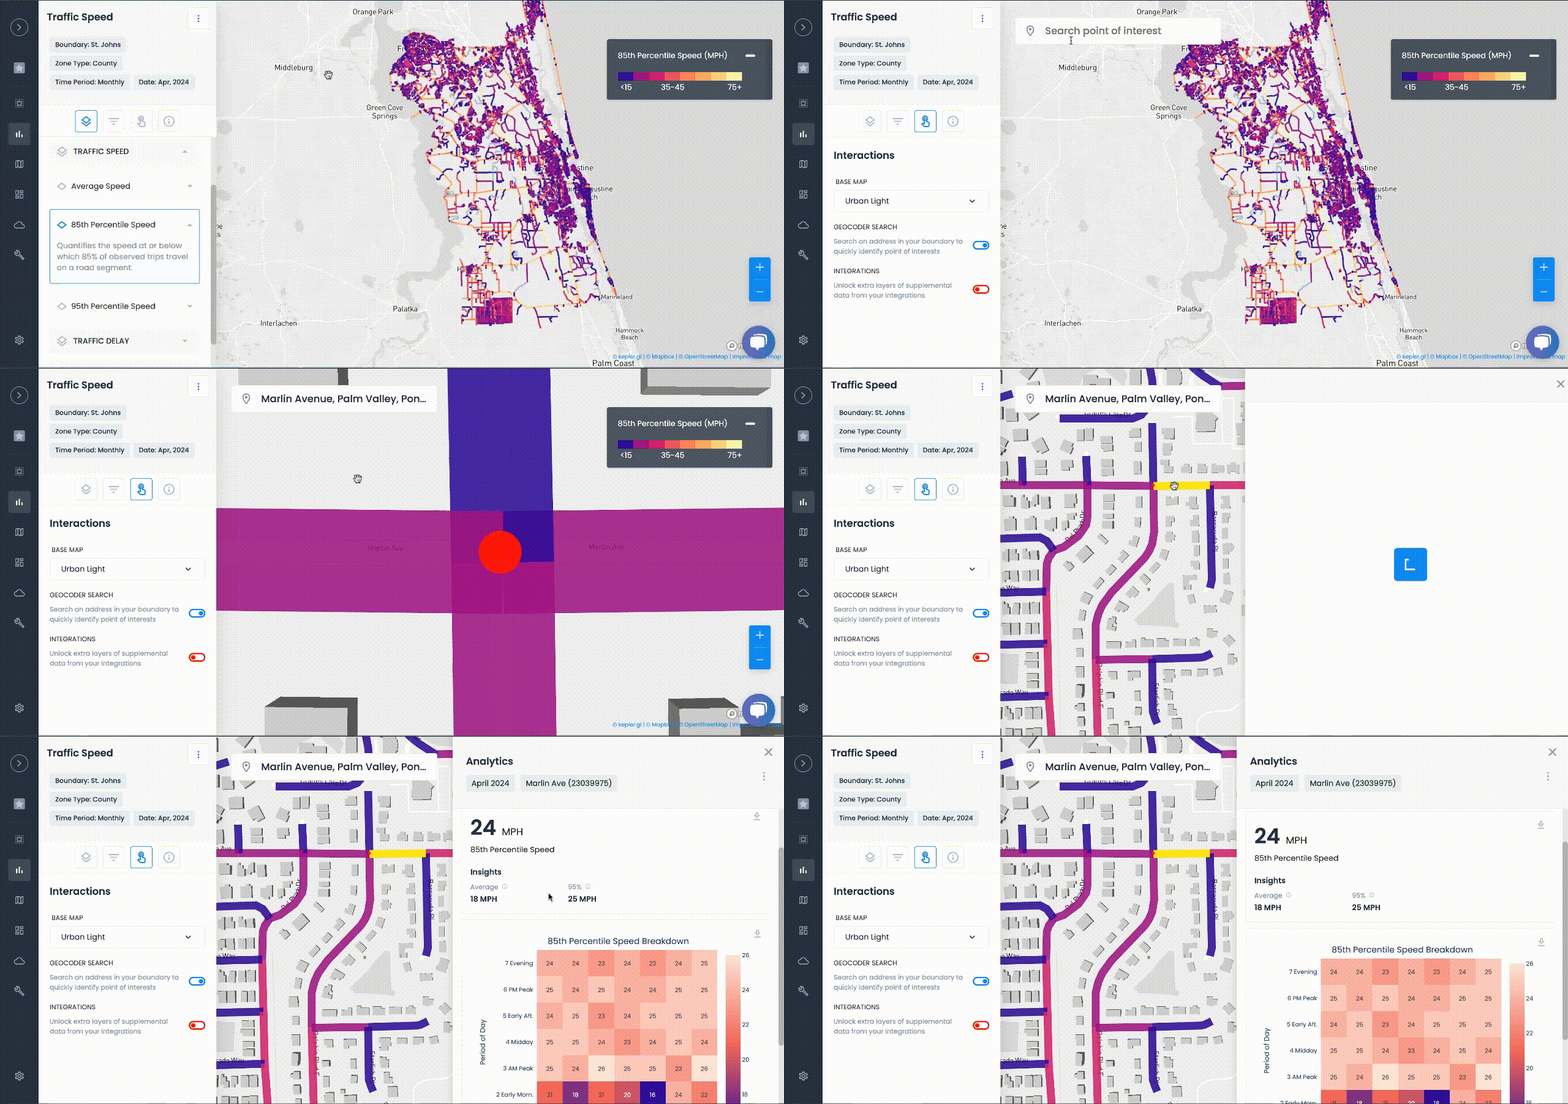
How Urban SDK can be used to identify hot spots by correlating high rates of speeds with crashes and/or incidents on the roadway.
Webinar overview | Safety planning
In this webinar we go over how Urban SDK can be used to identify hot spots by correlating high rates of speeds with crashes and/or incidents on the roadway.
By using Urban SDK's traffic speed data, along with your integrated crash safety database, you can create heat maps showcasing the most dangerous roadways in your jurisdiction.
What you will learn in this webinar
We cover ways you can use Urban SDK to proactively plan, create, and enforce safer roadways, with a Q&A at the end of the training session.
Use cases covered in this training webinar include:
- How to view roads with high rates of speed
- Correlating crashes to high rates of speeds on a roadway
- Creating a system of record to run safety analysis in minutes
- Reporting your findings to advocate for future capital dollars
Complete the form to see the full webinar
Transcription of the webinar
On today's webinar, what we want to do is want to talk about safety analysis, hotspot identification, and these are Kind of topics that dovetail very well from last week's webinar, where we analyzed speeds in a neighborhood that had recently laid down speed bumps following a tragic incident.
But in this training, we're going to be focusing a little bit more on safety from a macroscopic scale, and we're going to be diving into a few more of the tools that are available within your urban SDK platform. Now, if you want to know how to use Urban SDK speed data to identify these hotspots on your network, or if you're a community that's considering applying for an SS4A grant or has money to develop a safety action plan, this could be a useful demonstration for you.
It also comes in handy if you work closely with local law enforcement on enforcement of speed and safety problems. Since you have speeds on hand through your Urban SDK subscription, And because you can easily upload crash data into your account, it can become much quicker to run the safety diagnostics for a road or a corridor or segment, or even from a system wide perspective.
So really what we're looking to demonstrate today is how you can layer the information that you already have on top of your data from Urban SDK to get a better view of the safety concerns on your roadway and the intent. Just like with many of our previous webinars is to help you really hone in on areas that need the most help on your network and cut out the noise that can often come with looking at these networks from a large scale perspective.
So we're going to dive right in.

TRAFFIC ENFORCEMENT FEATURES
80% of citizen complaints
are a perception problem
Urban SDK provides precise hourly speed data to evaluate complaints and deploy resources efficiently for the greatest impact to public safety.
Urban SDK provides precise hourly speed data to evaluate complaints and deploy resources efficiently for the greatest impact to public safety.
Target Speeding
Identify hot spots, validate monthly speeding trends and monitor vulnerable areas like school zones.
Improve Safety
Crash and citations location information to compare speed trends month over month
Fast Response
Respond to citizen complaints sooner with address search and exportable reporting
Deploy Assets
Generate maps for traffic enforcement by time of day, location or division to deploy officers to known problem areas.
RESOURCES
Customer Success
See how public sector leaders succeed with Urban SDK.
WEBINAR
Identify speeding and proactively enforce issues
See just how quick and easy it is to identify speeding, address complaints, and deploy officers.


