Congestion Management
Historical Speed Study in Longboat Key, Florida
Tracking historical speeds to understand peak and offseason movement trends in Longboat Key, Florida
Project Overview
Longboat Key is an island off the west coast of Florida that measures roughly 10 miles long and one mile wide. Sandwiched in between two counties, Sarasota and Manatee, the island has only two points of ingress/egress — the island’s northern and southern sides.
A prototypical seasonal Florida community, the population in Longboat Key hovers around 8,000 year-round before ballooning to 20,000 during the winter season.
Long and narrow, neighborhoods on the island are usually distinguished as either bayside or beachside. This also results in the majority of traffic flowing out onto Gulf of Mexico Drive, the island’s main throughway.
With one artery and only two points of entry/exit, gridlock is always a primary point of emphasis — especially during the winter months. While they had good tribal knowledge of peak times and days, public works officials with the city sought a more defined way of understanding when and where congestion was at its worst.
Given Urban SDK’s nationwide presence, including in the aforementioned counties, stakeholders saw a unique opportunity to illustrate travel patterns in one of the state’s more beautiful seasonal retreats.
After working with Urban SDK, Longboat officials were able to understand peak-season travel delays, along with patterns during anomalous disruptions (festivals, farmers markets, etc.). As a result, after working with Urban SDK’s Planning Team, Longboat officials received a well-defined speed report, along with dashboards and visualizations, of all the Key’s prime times of congestion.

Methodology
Due to its geographic and demographic make- up, Longboat Key had a unique opportunity in front of itself when deciding to uncover congestion issues. The island only has two points of ingress and egress, one main throughway, and a well-defined peak season that sees its population balloon to more than double. As such, officials knew the roadway and the dates they wanted to explore.
Longboat officials sought to understand the city’s congestion issues using: Historical travel time data; peak seasonal travel time delays by most congested weeks of the year, days of the week, and hours of day; and any outliers pertaining to festivals or community events.
Not only did Urban SDK have all the data they needed to make a comprehensive speed study, but the platform’s reporting dashboards and map configurations were very good at explaining the findings with little added explanation.

Findings
The corridor saw an average increase of 4% in a.m. peak hour travel time delay between 2018-2022, whereas the corridor experienced a -1.6% decrease in p.m. peak hour travel time delay during the same period.
The greatest increases in delay were observed in Downtown Sarasota leading into the John Ringling Causeway, but there were also more localized increases in delay at the various pass bridges throughout the island. Comparing the northern and southern portions of the corridor revealed that the southern portion experiences more delays than the northern portion — an increase of 5.6% compared to 1.5%, respectively.
A review of the relative congestion across a typical day revealed that Wednesdays and Fridays were typically the most congested between the hours of 8am - 6pm, with a longer shoulder period on Saturdays until 9pm. The worst months for traffic congestion proved to be between February and April, the time of year when all snowbirds are in town to roost. Conversely, August and September typically experienced the least congestion.
Read the Full Report
Fill out the form below to read the full Congestion Report about Longboat Key, Florida.

TRAFFIC ENFORCEMENT FEATURES
80% of citizen complaints
are a perception problem
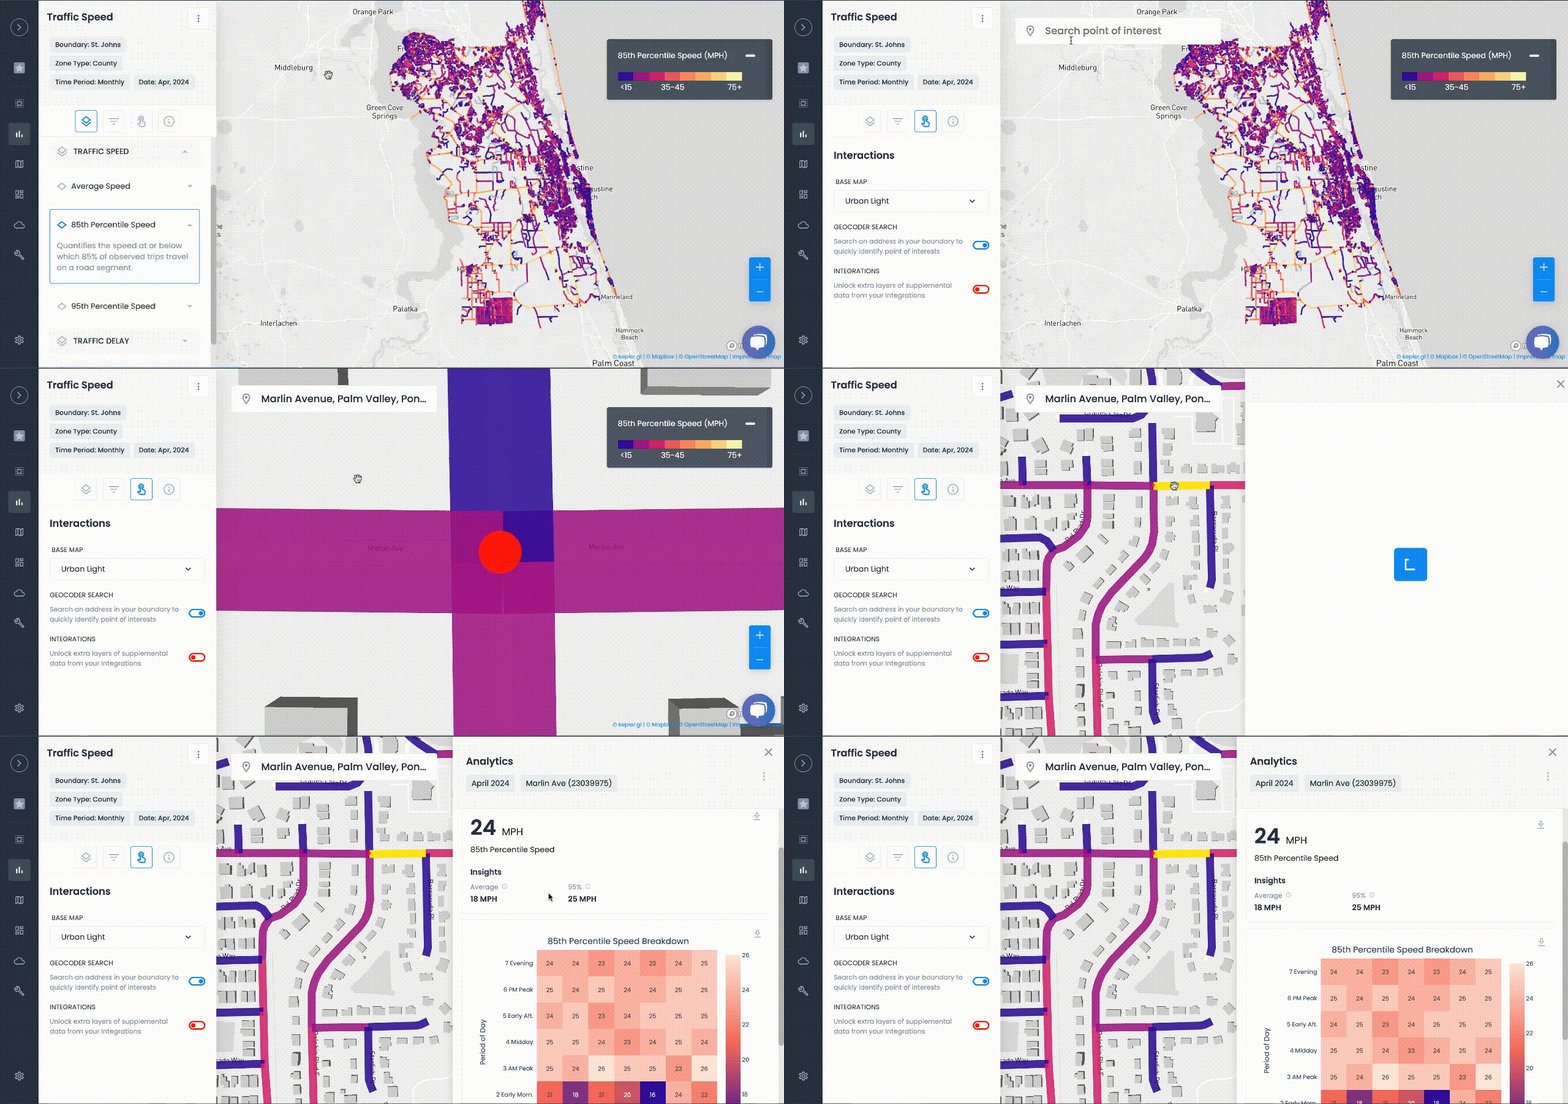
Urban SDK provides precise hourly speed data to evaluate complaints and deploy resources efficiently for the greatest impact to public safety.
Urban SDK provides precise hourly speed data to evaluate complaints and deploy resources efficiently for the greatest impact to public safety.
Target Speeding
Identify hot spots, validate monthly speeding trends and monitor vulnerable areas like school zones.
Improve Safety
Crash and citations location information to compare speed trends month over month
Fast Response
Respond to citizen complaints sooner with address search and exportable reporting
Deploy Assets
Generate maps for traffic enforcement by time of day, location or division to deploy officers to known problem areas.
RESOURCES
Customer Success
See how public sector leaders succeed with Urban SDK.
WEBINAR
Identify speeding and proactively enforce issues
See just how quick and easy it is to identify speeding, address complaints, and deploy officers.


